01
Original Price Distribution
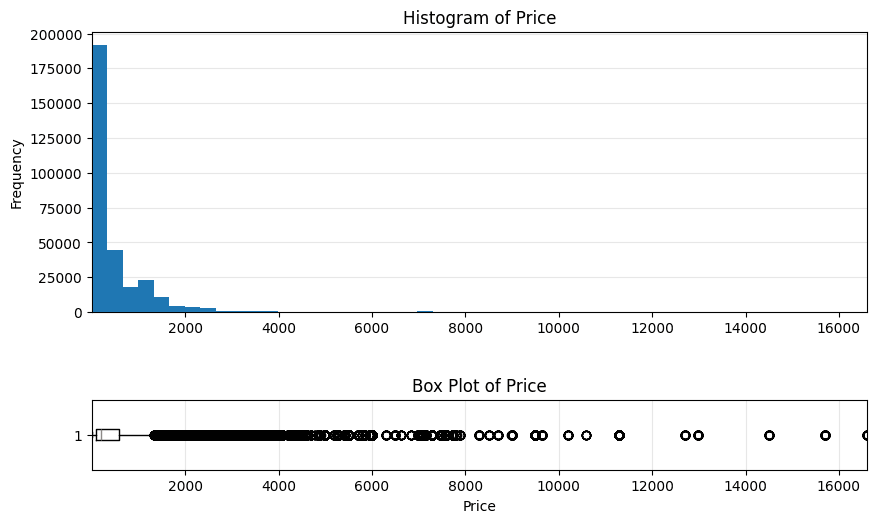
Raw product prices have a strongly right-skewed distribution. A small number of expensive products can stretch the scale and make the majority of observations harder to analyze.

An end-to-end machine learning project that explores e-commerce pricing data, engineers predictive features, and benchmarks regression algorithms to estimate product prices from historical marketplace observations.
Price Intelligence
Exploratory data analysis
Original records
303,982
Cleaned records
281,147
Data preparation
Exploration
CompleteCleaning
CompleteFeature engineering
CompleteModel benchmarking
EvaluatedHistorical marketplace data · January–March 2025
01 / Overview
Accurate price estimation requires more than fitting a regression model. The project starts by understanding the marketplace data, validating its quality, and identifying which product attributes carry meaningful pricing information.
Dataset size
306,226
Observations in the original analytical dataset.
Features
26
Product, shop, pricing, promotion, and temporal attributes.
Time coverage
81 days
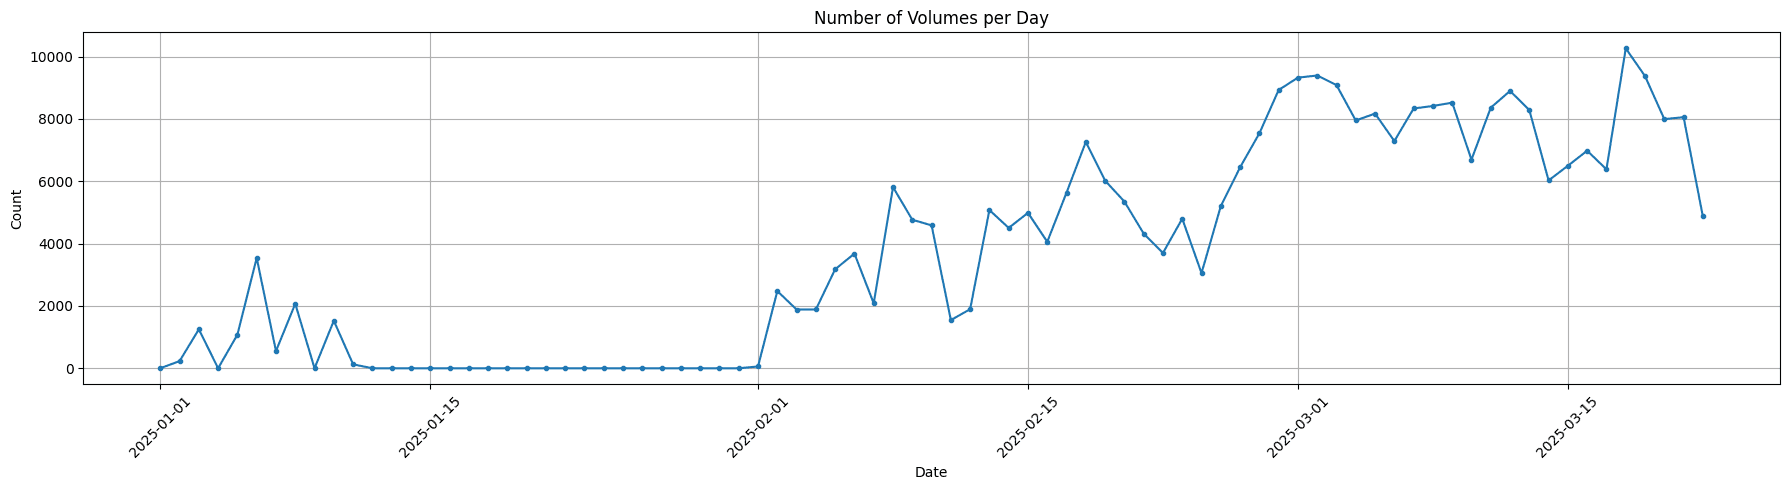
January 1 to March 22, 2025.
After cleaning
281,147
Records retained after data quality checks.
Develop a reproducible workflow for estimating product prices from historical structured data, then evaluate how different regression algorithms respond to numerical and categorical features.
Missing collection dates, duplicate records, inconsistent promotion information, invalid prices, outliers, and relationships between product identifiers all need to be investigated before modeling.
02 / Exploratory Data Analysis
The distribution of the target variable influences how a regression model learns. These visualizations compare raw product prices with their log1p-transformed values before modeling.
Raw product prices have a strongly right-skewed distribution. A small number of expensive products can stretch the scale and make the majority of observations harder to analyze.
Applying log1p compresses extreme values while preserving the ordering of prices. This produces a more manageable target distribution for regression experiments.
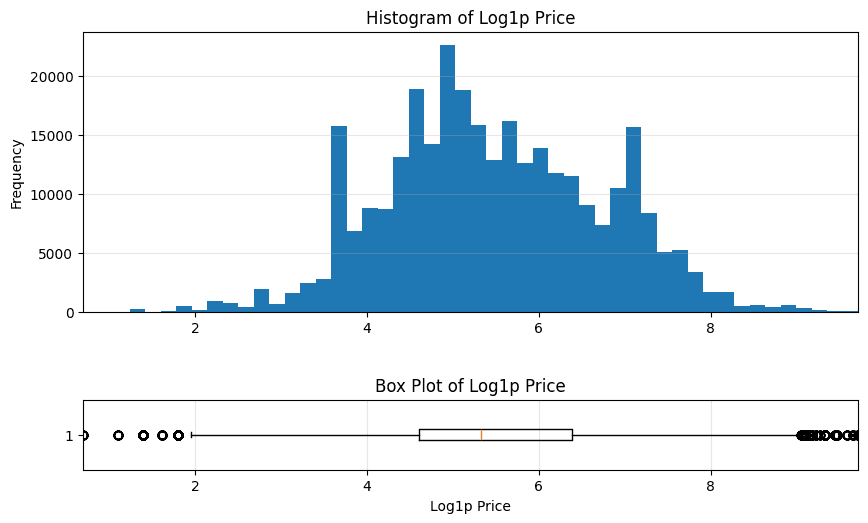
The transformation log1p(price) computes the natural logarithm of one plus the price. It reduces the influence of very large values on the target scale, making the distribution easier to inspect and potentially improving regression performance. Predictions in transformed space must be converted back with expm1 when prices in the original scale are required.
03 / Feature Analysis
Beyond the target distribution, the project examines relationships between product attributes, historical prices, promotions, and marketplace identifiers to understand which variables may help explain price variation.
item_price_min, item_price_max, and priceBeforeDiscount are identified as strong numerical predictors.
itemId and modelId capture product-level information that broader categories may not represent.
Discount calculations and promotional attributes are checked for consistency and anomalies.
Observation dates, weekend effects, and price stability help characterize changes over time.
Visual analysis of relationships in the dataset
04 / Methodology
The workflow is organized into notebook-based experiments, separating data exploration and preparation from regression baselines and categorical feature benchmarking.
Step 01
Investigate data quality, temporal coverage, price distributions, product relationships, promotions, and potential anomalies.
Step 02
Remove duplicate records, handle missing values, standardize categorical values, validate discounts, and filter invalid prices.
Step 03
Prepare temporal features, encode categorical variables, scale numerical features, and transform the target with log1p.
Step 04
Benchmark linear and tree-based regression algorithms using MAE, RMSE, MAPE, R², and training time.
Step 05
Compare XGBoost, LightGBM, and CatBoost using individual product and marketplace categorical features.
Before cleaning
303,982
Records entering the cleaning stage.
After cleaning
281,147
Records remaining after quality assurance.
05 / Experimental Results
The project evaluates classical regression baselines and compares three gradient boosting frameworks. The following tables show the documented categorical feature experiments, with the remaining numerical features kept in the experiment.
Best reported MAE
1.92
XGBoost using modelId.
Best reported RMSE
21.05
XGBoost using modelId.
Best reported MAPE
0.41%
XGBoost using modelId.
Reported R²
0.9995
XGBoost using modelId.
Across the documented categorical feature experiments, modelId provides the strongest reported results. This suggests that product-level identifiers contain substantial pricing information. However, the exceptionally high R² should be interpreted alongside the data split strategy and potential identifier leakage before assuming the same performance will generalize to unseen products.
Categorical feature comparison with remaining numerical features.
| Feature | MAE | RMSE | MAPE | R² |
|---|---|---|---|---|
| modelIdTop result | 1.92 | 21.05 | 0.41% | 0.9995 |
| itemId | 25.98 | 99.77 | 7.72% | 0.9885 |
| cat_id | 28.91 | 118.31 | 7.82% | 0.9838 |
| brand | 28.69 | 126.11 | 7.84% | 0.9816 |
| promotionId | 31.26 | 146.71 | 7.93% | 0.9752 |
Gradient boosting benchmark across individual categorical features.
| Feature | MAE | RMSE | MAPE | R² |
|---|---|---|---|---|
| modelIdTop result | 7.04 | 53.52 | 1.30% | 0.9967 |
| itemId | 26.49 | 102.22 | 7.56% | 0.9879 |
| brand | 27.40 | 101.03 | 8.00% | 0.9882 |
| cat_id | 27.68 | 100.87 | 8.02% | 0.9883 |
| promotionId | 27.80 | 100.67 | 8.11% | 0.9883 |
Alternative boosting model evaluated using the same feature groups.
| Feature | MAE | RMSE | MAPE | R² |
|---|---|---|---|---|
| modelIdTop result | 25.83 | 91.94 | 6.65% | 0.9902 |
| promotionId | 30.49 | 108.21 | 8.47% | 0.9865 |
| itemId | 30.55 | 108.18 | 8.47% | 0.9865 |
| brand | 30.60 | 107.76 | 8.51% | 0.9866 |
| cat_id | 30.62 | 108.32 | 8.46% | 0.9865 |
MAE
Mean Absolute Error measures the average absolute difference between predictions and actual values.
RMSE
Root Mean Squared Error penalizes larger prediction errors more heavily.
MAPE
Mean Absolute Percentage Error expresses errors relative to actual values, with limitations around zero-valued targets.
R²
The coefficient of determination measures how much target variation is explained by the model on the evaluated data.
06 / Key Takeaways
The findings emphasize data quality, target transformation, and the importance of selecting meaningful features before increasing model complexity.
01
Historical price attributes and product-level identifiers provide strong predictive signals in the evaluated dataset.
02
Log1p transformation reduces skewness and can make the target easier to model.
03
Linear models and tree-based ensembles provide useful baselines for understanding nonlinear pricing patterns.
04
Time-aware validation and product-level holdouts help assess whether a model predicts future prices or genuinely unseen products.
07 / Technology
A Python-based analytical workflow built around data manipulation, visualization, and classical machine learning.
Explore the implementation
Explore the notebooks, preprocessing steps, and model experiments in the project repository.